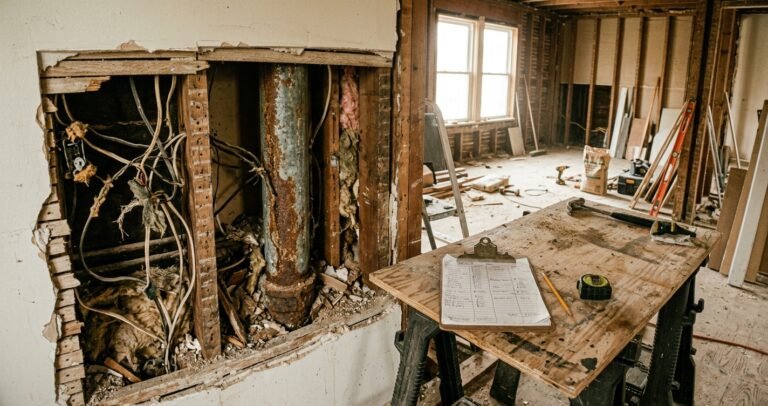

Budget vs actual on a house flip is the gap between the budget you built the week you closed and the money you actually spent. That gap is where flips lose money quietly, one category at a time, until it shows up on the settlement statement.
Budget drift is not rare. In the 2026 U.S. Houzz & Home Study, 37% of renovating homeowners spent more than their set budget in 2025, and roughly a third expanded the project scope mid-renovation (Houzz). On a flip the stakes are higher. Rehab and other costs run 20% to 33% of a property’s after-repair value by ATTOM’s own methodology note (ATTOM), so drift comes straight out of a thin margin.
Tracking it means comparing planned spend to real spend, category by category, every week of the rehab. Done right, an overrun surfaces in week three, while you can still react, instead of at closing, when you cannot. This guide covers the three numbers to track, how to run the weekly comparison, and what to do when a category runs over.
Key Takeaways
- Budget vs actual tracking compares your original estimate to real spend for each category, refreshed weekly.
- Track three numbers per category: budgeted, actual to date, and committed but unpaid. Together they give your projected final cost.
- Freeze the budget at closing and never edit it. The gap between estimate and actual is the data you are trying to see.
- Flag any category running more than about 10% over, and act before the overrun compounds.
- A small overrun caught in week three is a scope conversation. The same overrun found at closing is a loss.
The three numbers to track per category
For every line in your rehab budget, you are watching three figures.
Budgeted. Your original estimate for that category, set before demo started and never changed afterward. This is the baseline every comparison runs against.
Actual to date. Every dollar you have actually paid for that category so far: contractor payments, material receipts, permit fees. This is what your expense log adds up to today.
Committed but unpaid. Signed change orders, accepted bids, and pending invoices for work that is done or scheduled but not yet paid. This money is spent even though the check has not cleared.
Add actual and committed together and you get the projected final cost for that category. Compare that projection to budgeted, and you have your variance: over, under, or on track.
Worked on the plumbing line of a $45,000 rehab:
- Budgeted: $6,000
- Actual paid to date: $7,200
- Committed but unpaid (a signed change order for a repipe): $2,000
- Projected final cost: $9,200
- Variance: +$3,200, or 53% over budget
The paid column alone showed plumbing 20% over. Adding the committed change order shows it will finish 53% over. That is the number you act on, and a weekly review surfaces it while the rehab is still running, not at closing. For where these categories sit in the full deal, see how to calculate house flip profit.
Freeze the budget, then leave it alone
The single most common mistake in budget vs actual tracking is editing the budget when a category runs over. Do not.
When plumbing comes in $3,000 above estimate, it is tempting to bump the plumbing budget to match, so the tracker shows green again. That erases the one piece of information you were trying to capture: how far reality moved from your plan. A tracker that always shows on budget is telling you nothing.
Set the budget once, itemized into the categories you will record spending under, built from real bids rather than round numbers. Then lock it. Every change goes in the actual and committed columns. The budget column is a historical record, not a live document.
How to run the weekly comparison
Once the expense log is current, the comparison takes about ten minutes a week. Go category by category.
- Variance per category. Projected final cost minus budgeted. Flag anything more than roughly 10% over. A single category 40% over matters more than the whole budget being 4% over, because the aggregate hides it.
- Committed but unpaid. Make sure every signed change order and accepted bid is in the committed column. Projected cost that only reflects paid invoices is always too optimistic.
- Percent complete versus percent spent. If a category is 40% done but 70% of its budget is spent or committed, the trend is against you and the final number will be worse.
- Roll it up. Sum the projected final costs across every category. That total, plus your holding and selling costs, is your projected total spend. Subtract it from ARV for your current projected profit.
The output of the weekly review is one honest answer: is projected profit still above the number you would walk away for? If it is drifting toward that line, you have found a problem early enough to do something about it.
What to do when a category runs over
An overrun is not automatically a loss. You have three moves, usually in this order.
Find offsetting savings. A category that is over can sometimes be covered by one that is under, or by trimming scope somewhere the buyer will not notice. Swap a planned upgrade for a standard finish. Skip the deck rebuild if the comps do not support it.
Draw from contingency. This is what the contingency line is for. When the plumber finds cast iron, you pull from a bucket you already planned for, and your projected profit does not move. If you are burning contingency before the halfway point, though, treat that as a scope problem, not a rounding error. See how much contingency to budget for a house flip.
Accept the hit and re-run the number. Sometimes the overrun is real and unavoidable. In that case, update your projected profit, decide whether the deal still clears your minimum, and adjust your target list price or your timeline accordingly.
What you do not do is wait and hope. An overrun that is not addressed keeps growing, because the same scope pressure that caused it is still there. For the patterns behind most overruns, see why house flip budgets blow up.
Draw schedules and budget vs actual
If you are financing the rehab, your lender releases funds on a draw schedule tied to completion milestones. A typical fix-and-flip project runs four to eight draws. Each one is a reimbursement, paid only after the work is done, invoiced, and verified by an inspector, for a fee of roughly $150 to $300 per draw (Kiavi). Your budget vs actual tracking should drive those draws, not the other way around.
Request each draw against work that is actually done and inspected, matched to your actual spend, not against your original plan. If a draw funds more than the work completed, you are borrowing ahead. You pay interest on money sitting in your account while the matching work slips. Keep the draw schedule and the completion reality in sync, and the financing line behaves.
Frequently asked questions
What does budget vs actual mean on a house flip?
It means comparing your original rehab budget to what you have actually spent and committed, broken out by category, and updating that comparison every week. The point is to see an overrun while the rehab is running, not discover it at closing.
How often should I update budget vs actual?
Log expenses the day they happen and run the full comparison once a week. Weekly is frequent enough to catch a category drifting before it compounds, without turning tracking into a second job.
Should I change my budget when a category goes over?
No. Freeze the budget at closing. The gap between the frozen estimate and your actual spend is exactly the data you want. Record changes in the actual and committed columns instead.
What variance is worth acting on?
Flag any single category running more than about 10% over its budget, or any category where percent spent is well ahead of percent complete. The aggregate budget can look fine while one category quietly goes 50% over.
Track the gap, not just the total
The flips that surprise their owners at closing are almost always the ones where nobody watched the categories. Freeze the budget, track budgeted against actual and committed every week, act on the first category that drifts, and re-run your projected profit each time.
Do that and the settlement statement holds no surprises. Put the projection into the full deal with how to calculate house flip profit, and see the whole tracking workflow in house flip profit tracking, stage by stage.
This article is for education, not financial or investment advice. Portions were drafted with AI assistance and reviewed by the author.
About the author — Albert Chui. Albert Chui is a real estate investor in the San Gabriel Valley, California, who has flipped roughly 80 houses in the area since 2021. He ran those projects on spreadsheets at first, and learned firsthand how contractor changes, delays, and mid-rehab overruns quietly turn a profitable deal into a thin one. He founded FlipMargin so flippers can see current costs and projected profit throughout a rehab, not just at closing.